Gun Sales and Manufacturing Statistics [2022]
June 2022 Update: April 2022 had 2,607,477 NICS checks – this is the third-highest April on record (The prior April record for background checks for gun sales was from 2021). You can see the data below for NICS checks by month.
April’s gun sales followed the trend from last month which was also the third highest March on record.
Last year’s NICS total was 38,876,673 that is the second-highest number on record, beaten only by the year prior.
With these huge firearm sales numbers, it’s clear why there have been so many people getting their own FFLs.
Gun Sales Statistics
In this article, we’re going to explore:
- 2021 as a second highest record year for firearm sales
- Firearm Sale Background Checks
- Number of Firearms Manufactured in the U.S.
- Most Popular Firearms and Ammunition
- NICS Background Check Data by Month
2021 was clearly a strong year for firearm sales. Although it started out much stronger than 2020, background checks for gun sales dropped off and the yearly total for ’21 came in at the second-highest on record.
To put some stats into perspective, the firearms industry is fairly cyclical seeing most firearm sales at the start of hunting season in the Fall and just before Christmas.
Predictably, firearm sales also spike before elections in which there’s a larger than normal chance of major gun control (see Biden’s Gun Control Plan). Therefore, it should come as no surprise that the most recent record was 2020 and the second highest before that was from December 2016 – more guns were sold that month than any other month in recorded history. That is, of course, until 2020 came.
To explain how “off-the-charts” 2020 was, March 2020 (typically a very slow month of the year for firearm sales and typically too early to have an election bump) eclipsed December 2016 and set a new monthly firearm sales record of 2.3 million. The extreme increase was likely due to riots across the country and the defunding of police in democrat cities.
There is a very likely chance that firearm sales dropped off mid-2021 due to supply chain problems. So many firearms were purchased and millions of new gun owners decided to join the marketplace that there were simply no guns left in the stores.
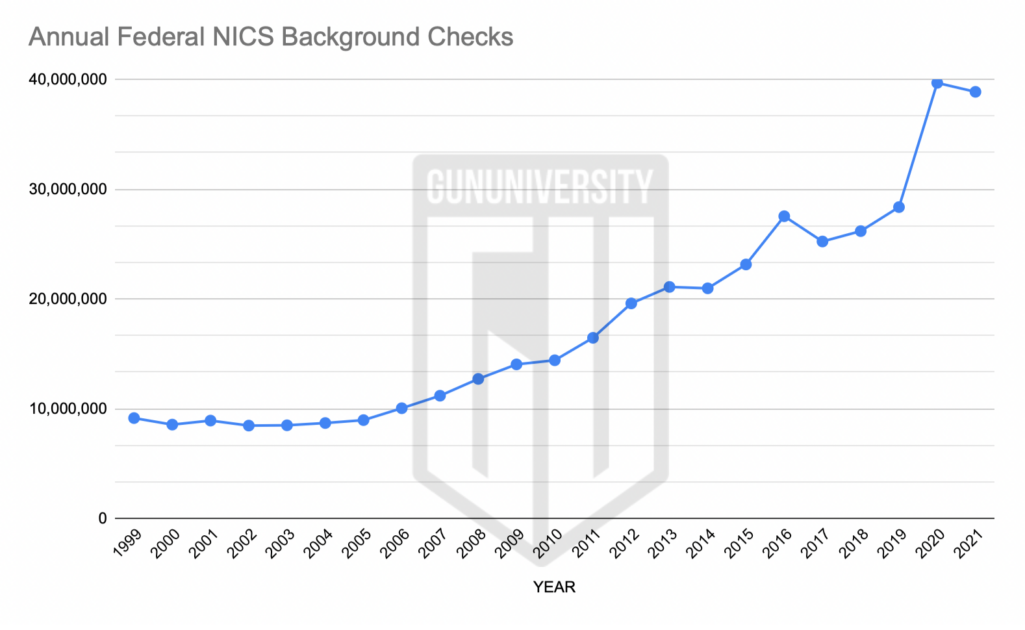
The previous record year of 2019 saw 28 million federal background checks (see below for how these relate to actual firearms sales). 2020 came in with 39.6 million! This is even more exceptional when you consider that most gun stores have been out of inventory for months – imagine how much higher the number could have been with more inventory.
| Year | Background Checks | |
|---|---|---|
| 2010 | 14,409,616 | |
| 2011 | 16,454,951 | |
| 2012 | 19,592,303 | |
| 2013 | 21,093,273 | |
| 2014 | 20,968,547 | |
| 2015 | 23,141,970 | |
| 2016 | 27,538,673 | |
| 2017 | 25,235,215 | |
| 2018 | 26,181,936 | |
| 2019 | 28,369,750 | |
| 2020 | 39,695,315 | |
| 2021 | 38,876,673 |
Firearm Sale Background Checks
Gun sales from licensed firearm dealers, also known as Federal Firearm Licensees (FFLs), typically require a federal firearm background check. This is true even if a firearm is purchased online. There are two main exceptions to the background check requirement for firearm purchases:
- 21 states have their own background check system that can be used instead of the federal system, and
- Some states have concealed carry licenses/permits that allow a purchaser to skip the background check for a firearm purchase because one was already done for their permit/license.
The FBI’s National Instant Criminal Check System (NICS) is our federal firearm background check system used by FFLs. Therefore, a strong indicator of relative firearm sales for any given month is to see how many NICS checks have been processed. The NICS number of background checks is not a direct indication of the number of firearms sold, however, for a few reasons:
- Some background checks find criminal issues that result in a cancelled/denied sale,
- Some firearm sales don’t have federal background checks (see above), and
- In rare circumstances, some states use the NICS system for permit renewals that aren’t tied to actual firearms sales.
Despite these potential inconsistencies in NICS numbers, the total number of background checks is still a reliable source for seeing trends in the industry. The National Shooting Sports Foundation (NSSF), is the firearms industry’s trade association. For a more accurate picture of which NICS checks might be related to actual firearm sales, they adjust the raw NICS background check data with their own research, to hopefully paint a more accurate picture. Furthermore, a recent study was made analyzing the type and thoughts of those who purchased weapons recently.
Firearms Manufactured In The U.S.
Federal regulations, in 27 CFR § 478.123, require that firearm manufacturers (Type 07 and Type 10 FFLs) report the number and type of firearms they made each year.
The ATF publishes these numbers of firearms manufactured each year with a 2-year delay so as not to revel current competitive/commercial data. Despite the delay, it is still valuable to see gun manufacturing trends in our country.
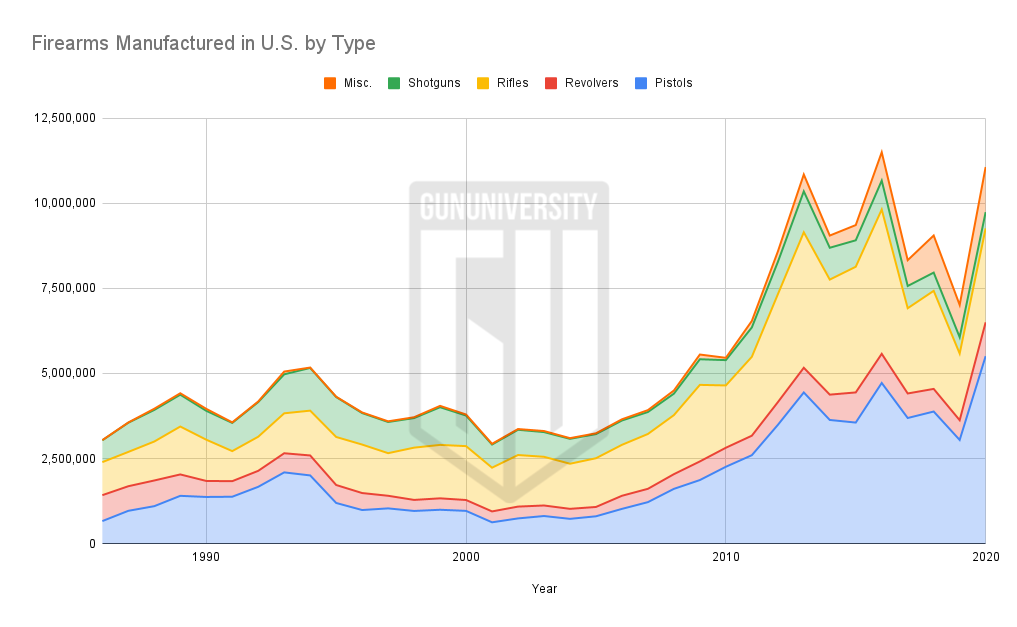
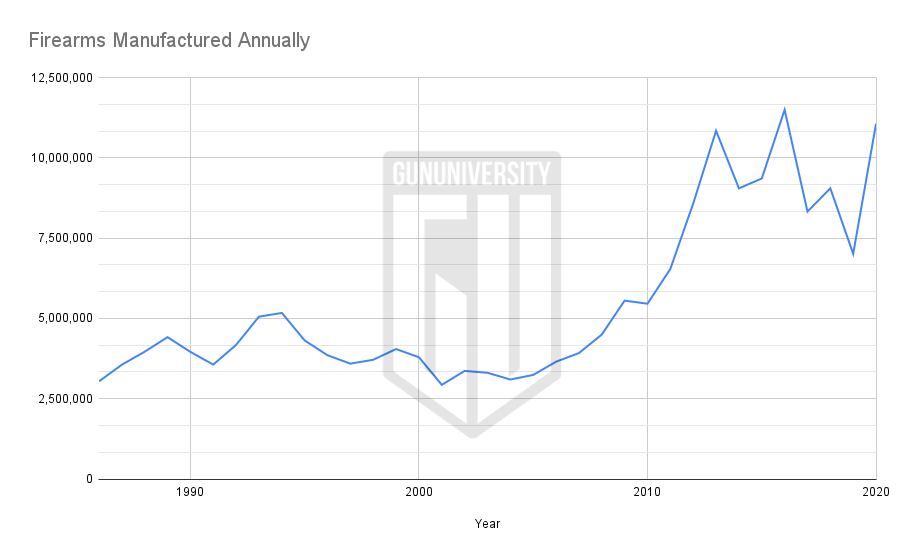
Here is a chart showing how many of each type of firearm are manufactured in the U.S. each year (Data from ATF) and a chart showing the total number of guns made and a table of the raw data.
As you can see in the graphs below, firearm manufacturing in 2020 rose sharply and nearly broke the previous record of the number of firearms made in a year in the United States from 2016.
| Year | Pistols | Revolvers | Rifles | Shotguns | Misc. | Total |
|---|---|---|---|---|---|---|
| 2020 | 5,509,183 | 993,078 | 2,760,392 | 476,682 | 1,324,743 | 11,064,078 |
| 2019 | 3,046,013 | 580,601 | 1,957,667 | 480,735 | 946,929 | 7,011,945 |
| 2018 | 3,881,158 | 664,835 | 2,880,536 | 536,126 | 1,089,973 | 9,052,628 |
| 2017 | 3,691,010 | 720,917 | 2,504,092 | 653,139 | 758,634 | 8,327,792 |
| 2016 | 4,720,075 | 856,291 | 4,239,335 | 848,617 | 833,123 | 11,497,441 |
| 2015 | 3,557,199 | 885,259 | 3,691,799 | 777,273 | 447,131 | 9,358,661 |
| 2014 | 3,633,454 | 744,047 | 3,379,549 | 935,411 | 358,165 | 9,050,626 |
| 2013 | 4,441,726 | 725,282 | 3,979,570 | 1,203,072 | 495,142 | 10,844,792 |
| 2012 | 3,487,883 | 667,357 | 3,168,206 | 949,010 | 306,154 | 8,578,610 |
| 2011 | 2,598,133 | 572,857 | 2,318,088 | 862,401 | 190,407 | 6,541,886 |
| 2010 | 2,258,450 | 558,927 | 1,830,556 | 743,378 | 67,929 | 5,459,240 |
| 2009 | 1,868,258 | 547,195 | 2,248,851 | 752,699 | 138,815 | 5,555,818 |
| 2008 | 1,609,381 | 431,753 | 1,734,536 | 630,710 | 92,564 | 4,498,944 |
| 2007 | 1,219,664 | 391,334 | 1,610,923 | 645,231 | 55,461 | 3,922,613 |
| 2006 | 1,021,260 | 385,069 | 1,496,505 | 714,618 | 35,872 | 3,653,324 |
| 2005 | 803,425 | 274,205 | 1,431,372 | 709,313 | 23,179 | 3,241,494 |
| 2004 | 728,511 | 294,099 | 1,325,138 | 731,769 | 19,508 | 3,099,025 |
| 2003 | 811,660 | 309,364 | 1,430,324 | 726,078 | 30,978 | 3,308,404 |
| 2002 | 741,514 | 347,070 | 1,515,286 | 741,325 | 21,700 | 3,366,895 |
| 2001 | 626,836 | 320,143 | 1,284,554 | 679,813 | 21,309 | 2,932,655 |
| 2000 | 962,901 | 318,960 | 1,583,042 | 898,442 | 30,196 | 3,793,541 |
| 1999 | 995,446 | 335,784 | 1,569,685 | 1,106,995 | 39,837 | 4,047,747 |
| 1998 | 960,365 | 324,390 | 1,535,690 | 868,639 | 24,506 | 3,713,590 |
| 1997 | 1,036,077 | 370,428 | 1,251,341 | 915,978 | 19,680 | 3,593,504 |
| 1996 | 987,528 | 498,944 | 1,424,315 | 925,732 | 17,920 | 3,854,439 |
| 1995 | 1,195,284 | 527,664 | 1,411,120 | 1,173,645 | 8,629 | 4,316,342 |
| 1994 | 2,004,298 | 586,450 | 1,316,607 | 1,254,926 | 10,936 | 5,173,217 |
| 1993 | 2,093,362 | 562,292 | 1,173,694 | 1,144,940 | 81,349 | 5,055,637 |
| 1992 | 1,669,537 | 469,413 | 1,001,833 | 1,018,204 | 16,849 | 4,175,836 |
| 1991 | 1,378,252 | 456,966 | 883,482 | 828,426 | 15,980 | 3,563,106 |
| 1990 | 1,371,427 | 470,495 | 1,211,664 | 848,948 | 57,434 | 3,959,968 |
| 1989 | 1,404,753 | 628,573 | 1,407,400 | 935,541 | 42,126 | 4,418,393 |
| 1988 | 1,101,011 | 754,744 | 1,144,707 | 928,070 | 35,345 | 3,963,877 |
| 1987 | 964,561 | 722,512 | 1,007,661 | 857,949 | 6,980 | 3,559,663 |
| 1986 | 662,973 | 761,414 | 970,507 | 641,482 | 4,558 | 3,040,934 |
Most Popular Firearms and Ammunition
At Gun University, we have the unique opportunity to see the most popular firearms and ammunition researched (and, in some cases, purchased).
Our information shows record levels of interest in tactical shotguns and semi-automatic rifles – specifically AK-47 style rifles. This was surprising to us.
According to the FFL community of RocketFFL, the most popular firearm sales for the past year have been semi-automatic handguns (specifically Sig’s p365 and p365xl and Glock’s 43x and 48 – all small pistols intended for concealed carry). However, this year’s rush on firearms in gun stores has resulted in the same information we’re seeing here: a surprising increase in shotguns.
As far as ammunition goes, our reports are showing that 9mm Luger, 223 Remington, and 7.62×39mm ammunition are some of the most popular calibers. This is no surprise as these are typically the calibers most used and purchased in bulk. However, matching the sudden increase in shotguns is a big run on shotgun shells in stores across the country.
One of the most popular topics we’ve seen with all of these new gun owners concerned about having a firearm for self defense is concealed carry insurance.
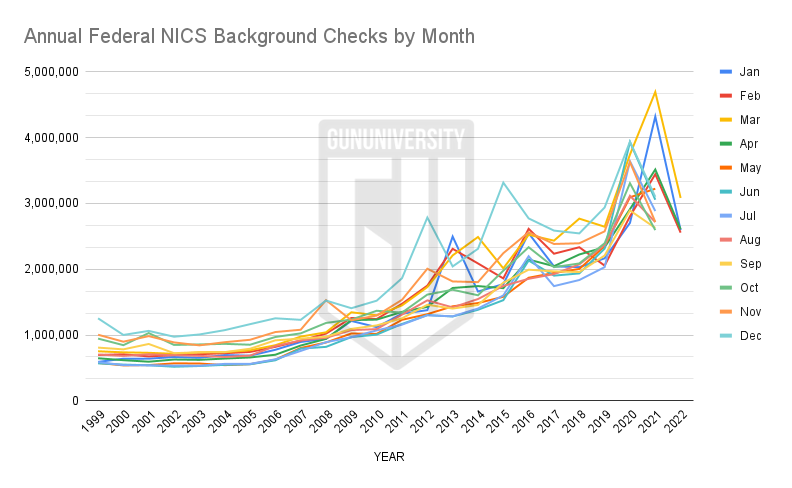
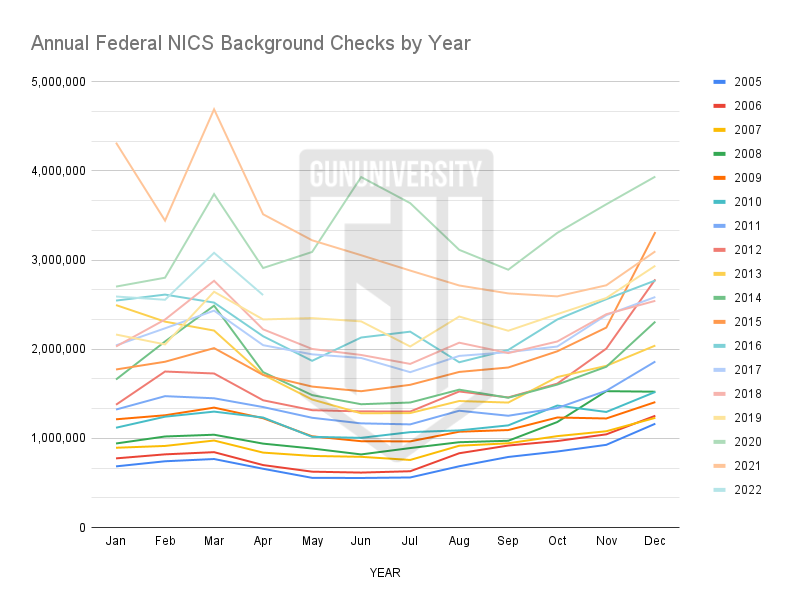
NICS Background Check Data by Month
Here is a chart and a table of the raw NICS background check data by month by the FBI to help illustrate the trend in firearm sales over time.
| Year | Jan | Feb | Mar | Apr | May | Jun | Jul | Aug | Sep | Oct | Nov | Dec | |
|---|---|---|---|---|---|---|---|---|---|---|---|---|---|
| 1999 | 591,355 | 696,323 | 753,083 | 646,712 | 576,272 | 569,493 | 589,476 | 703,394 | 808,627 | 945,701 | 1,004,333 | 1,253,354 | 9,138,123 |
| 2000 | 639,972 | 707,070 | 736,543 | 617,689 | 538,648 | 550,561 | 542,520 | 682,501 | 782,087 | 845,886 | 898,598 | 1,000,962 | 8,543,037 |
| 2001 | 640,528 | 675,156 | 729,532 | 594,723 | 543,501 | 540,491 | 539,498 | 707,288 | 864,038 | 1,029,691 | 983,186 | 1,062,559 | 8,910,191 |
| 2002 | 665,803 | 694,668 | 714,665 | 627,745 | 569,247 | 518,351 | 535,594 | 693,139 | 724,123 | 849,281 | 887,647 | 974,059 | 8,454,322 |
| 2003 | 653,751 | 708,281 | 736,864 | 622,832 | 567,436 | 529,334 | 533,289 | 683,517 | 738,371 | 856,863 | 842,932 | 1,008,118 | 8,481,588 |
| 2004 | 695,000 | 723,654 | 738,298 | 642,589 | 542,456 | 546,847 | 561,773 | 666,598 | 740,260 | 865,741 | 890,754 | 1,073,701 | 8,687,671 |
| 2005 | 685,811 | 743,070 | 768,290 | 658,954 | 557,058 | 555,560 | 561,358 | 687,012 | 791,353 | 852,478 | 927,419 | 1,164,582 | 8,952,945 |
| 2006 | 775,518 | 820,679 | 845,219 | 700,373 | 626,270 | 616,097 | 631,156 | 833,070 | 919,487 | 970,030 | 1,045,194 | 1,253,840 | 10,036,933 |
| 2007 | 894,608 | 914,954 | 975,806 | 840,271 | 803,051 | 792,943 | 757,884 | 917,358 | 944,889 | 1,025,123 | 1,079,923 | 1,230,525 | 11,177,335 |
| 2008 | 942,556 | 1,021,130 | 1,040,863 | 940,961 | 886,183 | 819,891 | 891,224 | 956,872 | 973,003 | 1,183,279 | 1,529,635 | 1,523,426 | 12,709,023 |
| 2009 | 1,213,885 | 1,259,078 | 1,345,096 | 1,225,980 | 1,023,102 | 968,145 | 966,162 | 1,074,757 | 1,093,230 | 1,233,982 | 1,223,252 | 1,407,155 | 14,033,824 |
| 2010 | 1,119,229 | 1,243,211 | 1,300,100 | 1,233,761 | 1,016,876 | 1,005,876 | 1,069,792 | 1,089,374 | 1,145,798 | 1,368,184 | 1,296,223 | 1,521,192 | 14,409,616 |
| 2011 | 1,323,336 | 1,473,513 | 1,449,724 | 1,351,255 | 1,230,953 | 1,168,322 | 1,157,041 | 1,310,041 | 1,253,752 | 1,340,273 | 1,534,414 | 1,862,327 | 16,454,951 |
| 2012 | 1,377,301 | 1,749,903 | 1,727,881 | 1,427,343 | 1,316,226 | 1,302,660 | 1,300,704 | 1,526,206 | 1,459,363 | 1,614,032 | 2,006,919 | 2,783,765 | 19,592,303 |
| 2013 | 2,495,440 | 2,309,393 | 2,209,407 | 1,714,433 | 1,435,917 | 1,281,351 | 1,283,912 | 1,419,088 | 1,401,562 | 1,687,599 | 1,813,643 | 2,041,528 | 21,093,273 |
| 2014 | 1,660,355 | 2,086,863 | 2,488,842 | 1,742,946 | 1,485,259 | 1,382,975 | 1,402,228 | 1,546,497 | 1,456,032 | 1,603,469 | 1,803,397 | 2,309,684 | 20,968,547 |
| 2015 | 1,772,794 | 1,859,584 | 2,012,488 | 1,711,340 | 1,580,980 | 1,529,057 | 1,600,832 | 1,745,410 | 1,795,102 | 1,976,759 | 2,243,030 | 3,314,594 | 23,141,970 |
| 2016 | 2,545,802 | 2,613,074 | 2,523,265 | 2,145,865 | 1,870,000 | 2,131,485 | 2,197,169 | 1,853,815 | 1,992,219 | 2,333,539 | 2,561,281 | 2,771,159 | 27,538,673 |
| 2017 | 2,043,184 | 2,234,817 | 2,433,092 | 2,045,564 | 1,942,677 | 1,901,768 | 1,742,546 | 1,925,146 | 1,967,104 | 2,030,391 | 2,382,788 | 2,586,138 | 25,235,215 |
| 2018 | 2,030,530 | 2,333,193 | 2,767,699 | 2,223,213 | 2,002,992 | 1,935,691 | 1,835,318 | 2,073,296 | 1,956,681 | 2,086,895 | 2,393,043 | 2,543,385 | 26,181,936 |
| 2019 | 2,165,094 | 2,053,886 | 2,644,851 | 2,334,249 | 2,349,309 | 2,312,309 | 2,030,661 | 2,366,824 | 2,207,312 | 2,393,609 | 2,574,752 | 2,936,894 | 28,369,750 |
| 2020 | 2,702,702 | 2,802,467 | 3,740,688 | 2,911,128 | 3,091,455 | 3,931,607 | 3,639,224 | 3,115,063 | 2,892,115 | 3,305,465 | 3,626,335 | 3,937,066 | 39,695,315 |
| 2021 | 4,317,804 | 3,442,777 | 4,691,738 | 3,514,070 | 3,222,105 | 3,054,726 | 2,882,676 | 2,715,223 | 2,626,389 | 2,593,168 | 2,717,458 | 3,098,539 | 38,876,673 |
| 2022 | 2,591,588 | 2,554,912 | 3,081,724 | 2,607,477 | |||||||||
| 2023 | 1,156,223 | ||||||||||||
| 2024 |
About Ryan Cleckner
Ryan Cleckner is a former special operations sniper (1st Ranger Battalion, 75th Ranger Regiment) and current firearms attorney, firearms-industry executive, and university lecturer. He is the bestselling author of the Long Range Shooting Handbook, one of the most widely read primers on precision-rifle fundamentals, and co-founded Gun University to bring honest, expertise-driven gun reviews and firearms education to shooters at every level. His work bridges the practical and the legal: real trigger time at the highest level of military marksmanship, paired with a working attorney's command of firearms law, ATF regulation, and the industry itself. You can find more of his work at ryancleckner.com.
Recent Posts
![Best Bullpup Rifles & Shotguns [ 2026]](https://gununiversity.com/wp-content/uploads/2026/02/Bullpup.jpg)
July 25, 2026
![Best First Handgun of 2026: [Beginners Guide]](https://gununiversity.com/wp-content/uploads/2025/09/BFH.jpg)
July 25, 2026

July 21, 2026

July 21, 2026
Based on numbers I have found, there are about 9 million firearms manufactured annually in the USA. Additionally an average of 4 million firearms imported. Not allowing for military consumption, the firearm supply in the USA grows at most 13 million units annually. You cannot equate background checks with increased ownership especially new firearm owners.
Ryan, great article. I check in every now and then to see what the sales are like. This is a go to for quick stats. Thanks for putting this together.
Great article, Ryan! It’s interesting to see the trend busters in this data. The largest being the dramatic fall in gun sales during Trump’s first year in office (25.57% decrease), which was after the 2016 election-year increase of 22.85% in sales; the driving force there was the expectation that Hillary would win.
Typically, it’s the first year of a new administration when gun sales rise compared to the previous election-year percentages. That “trend” didn’t hold during the Clinton midterm election or the 2000 Presidential election.
Not surprisingly, we saw huge spikes in sales both during and after Obama’s re-election — 31.13% increase during the 2012 election year and 26.42% increase in 2013. Obama was hands down the gun industry’s best friend when it came to sales. I’m predicting Biden will blow Obama out of the water as a gun salesman.
Anyway, the Democrats are their own worst enemy when it comes to increasing guns sales and new gun ownership, but we already knew that. It’s difficult to be anti-gun when you yourself own a gun. New gun ownership is key to winning this battle. As such, I think these numbers are encouraging.